Generating interesting
high-dimensional data structures
Joint work with Prof Dianne Cook, Dr Paul Harrison, Dr Michael Lydeamore, Dr Thiyanga S. Talagala
Existing software

Lack of control over cluster shapes


cardinalR
collection of various high-dimensional data structures in R
What do we implement in our R package?
Generation of geometric structures in arbitrary dimensions.
Control over background noise, clustering,
and sample positioning.Generation of explainable, challenging synthetic datasets for
benchmarking high-dimensional methods.

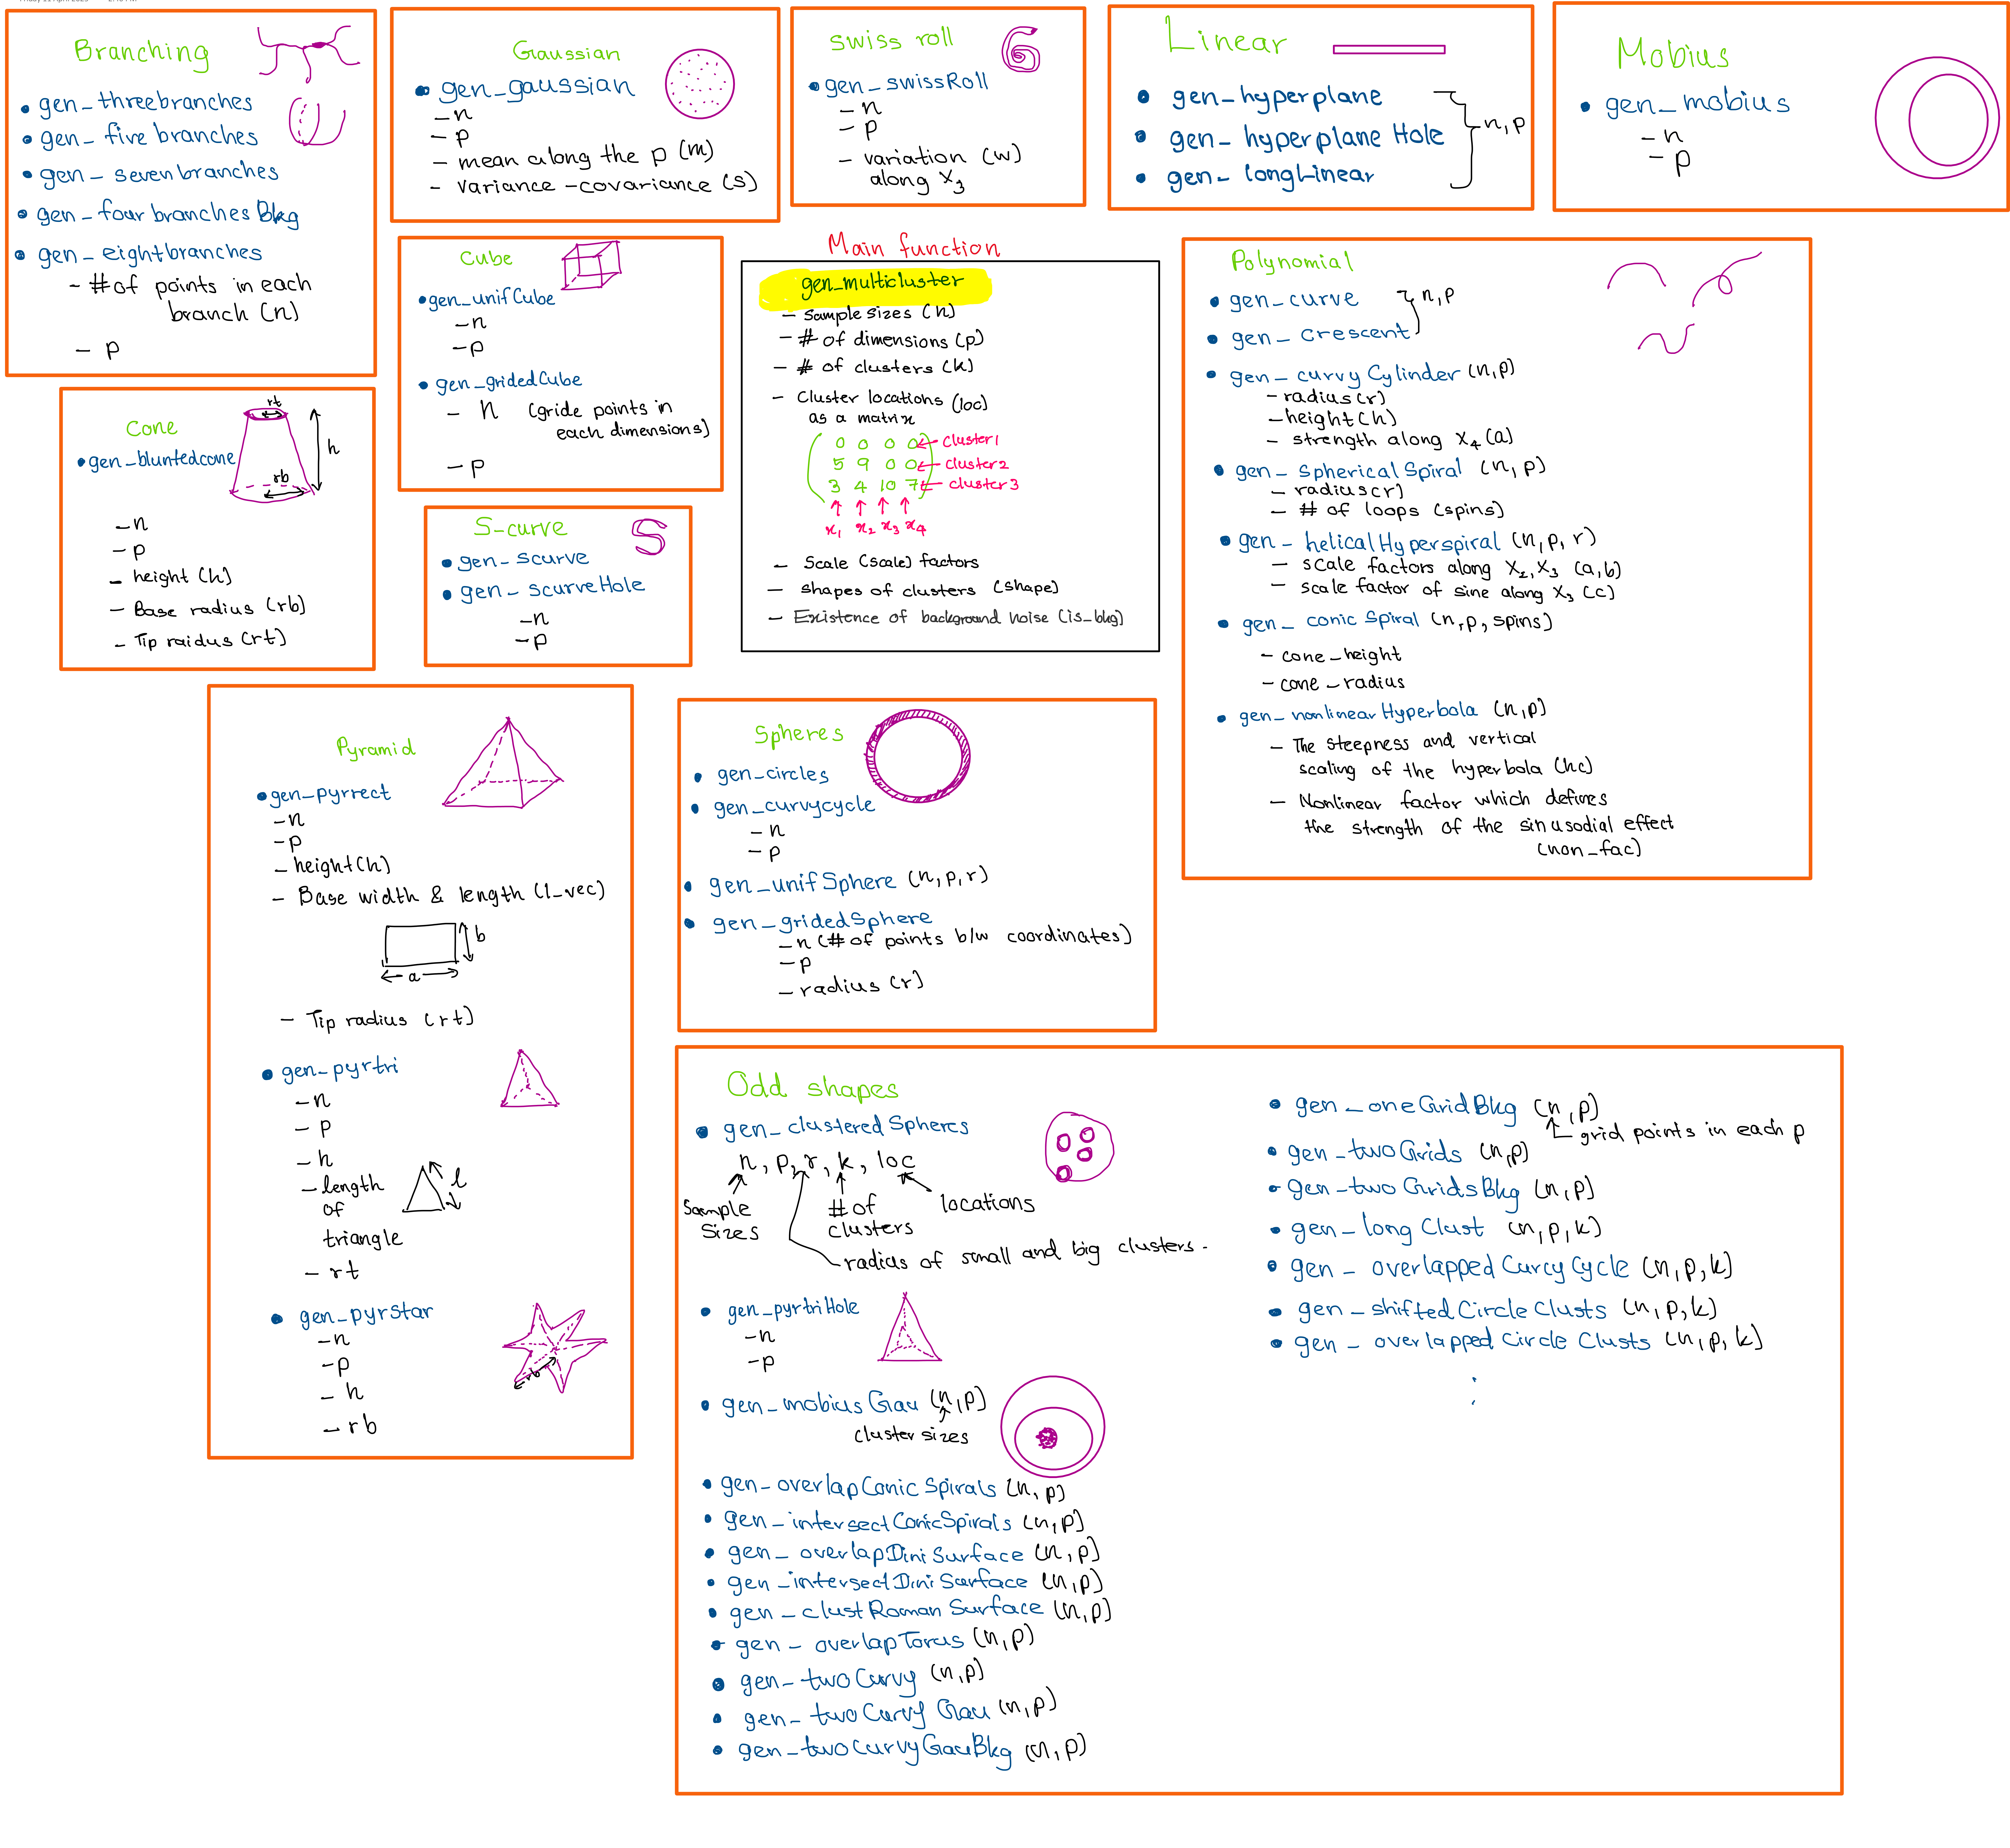
Shape generators
Branching
Cone
Cube
Linear
Mobius
Polynomial
Pyramid
Scurve
Sphere
Swiss roll
Trefoil
Trigonometric
Branching
Pyramid
Cube
Polynomial
Sphere
Trigonometric
Implementation
Let’s combine !!!
Generate clusters
Different shaped clusters (shape) with different
sample sizes (
n)location (
loc)scale (
scale)rotation (
rotation)
with or without background noise (is_bkg)
Examples
# A tibble: 1,500 × 5
       x1      x2      x3      x4 cluster
    <dbl>   <dbl>   <dbl>   <dbl> <chr>
1 -0.109  -0.0144  0.108  -0.0820 cluster2
2 -0.450  -0.650  -0.122   0.0414 cluster1
3 -0.496  -0.411   0.230   0.0438 cluster1
4 -0.0147  0.0454 -0.0634 -0.0633 cluster2
5  0.370  -0.539   0.0263  0.0287 cluster1
6 -0.0122 -0.690   0.0270  0.0710 cluster1
# ℹ 1,494 more rows
loc_matrix <- matrix(
c(0, 0, 0, 0,
5, 9, 0, 0,
3, 4, 10, 7
), nrow = 3, byrow = TRUE)
multigau <- make_multigau(n = c(300, 200, 500), p = 4, k = 3, loc = loc_matrix, scale = c(0.2, 1.5, 0.5))
multigau# A tibble: 1,000 × 5
x1 x2 x3 x4 cluster
<dbl> <dbl> <dbl> <dbl> <chr>
1 2.89 4.13 10.1 7.15 cluster3
2 3.06 3.98 9.92 7.00 cluster3
3 0.0125 0.144 -0.0449 0.0189 cluster1
4 3.01 4.12 9.94 6.99 cluster3
5 5.46 9.39 -0.598 -0.380 cluster2
6 2.83 4.05 10.1 6.78 cluster3
# ℹ 994 more rowsApplication
positions <- geozoo::simplex(p=4)$points
positions <- positions * 0.8

## To generate data
five_clusts <- gen_multicluster(n = c(2250, 1500, 750, 1250, 1750),
                                p = 4, k = 5, loc = positions,
                                scale = c(0.4, 0.35, 0.3, 1, 0.3),
                                shape = c("helicalspiral",
                                          "hemisphere", "unifcube",
                                          "cone", "gaussian"),
                                rotation = NULL,
                                is_bkg = FALSE)
Data
Dimension reduction layouts

- tSNE, b. UMAP, c. PAHTE, d. TriMAP, e. PaCMAP, and f. PCA.
Summary
✨ Key features
- 🔢 Flexible dimensions (
p) and number of clusters (k) - 📍 Custom cluster locations with
locmatrix - 🎨 Geometric variety:
"pyrstar","conicspiral","hemisphere", etc. - 🌀 Optional rotation for complexity
- 🌫️ Background noise (
is_bkg = TRUE) to simulate real-world conditions - ⚖️ Individual cluster scales and shapes
🚀 cardinalR empowers researchers To:
- 🔬 Simulate interpretable high-dimensional data structures
- 🧪 Benchmark and compare NLDR and clustering methods
- 🧭 Explore algorithm performance under controlled challenges
- 🎯 Develop and validate new analytical tools
- 🌍 Enable reproducible, cross-domain experimentation
💡 Build better algorithms by knowing what your data really looks like.

Jayani P.G. Lakshika 
Collaborators: Prof Dianne Cook, Dr Paul Harrison, Dr Michael Lydeamore, Dr Thiyanga S. Talagala